2024 has been a year marked by exceptional returns for a relatively small number of high-flying growth stocks. In recent weeks, top performers like Nvidia (NVDA) have pulled back, and Super Micro Computer (SMCI) remains well below its all-time high from earlier this year. So can the major equity benchmarks continue their Q2 strength if these stocks are not breaking out?
First, let’s review the market conditions as defined by the performance of the S&P 500 index.
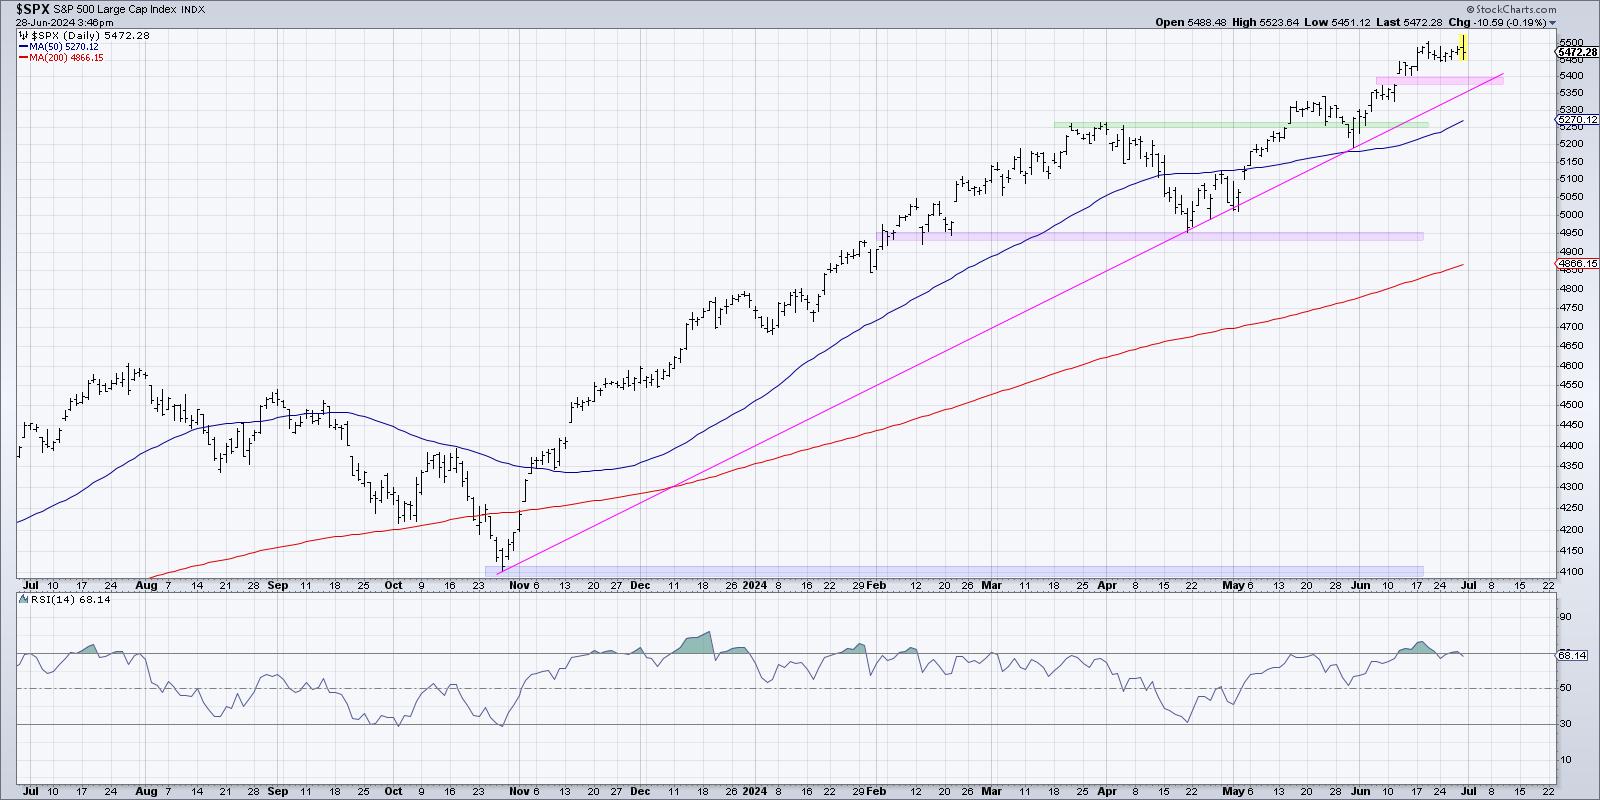
Friday’s session, which initially showed a strong upside reaction after the release of the latest data for the Fed’s favorite measure of inflation, ended up showing weakness as the S&P failed to close above the 5500 level. We remain constructive on the SPX as long as it remains above our “line in the sand” of 5400, which lines up well with trendline support using the major market lows back to October 2023.
I’m meeting up with my Market Misbehavior premium members on Tuesday, July 2nd, to conduct our virtual Monthly Chart Review of key charts to watch in Q3. I’d love for you to join us in this interactive discussion of market conditions! Find more info HERE and use code STOCKCHARTS at checkout for 20% off your first 12 months.
Looking a little closer at some of the top performers in 2024, we can see that some names have dramatically outperformed the SPX in the first half of the year. SMCI is up almost 200% year-to-date, Nvidia has gained around 150%, and the rest of the top ten are all over 50% compared to the S&P 500’s +15% return.
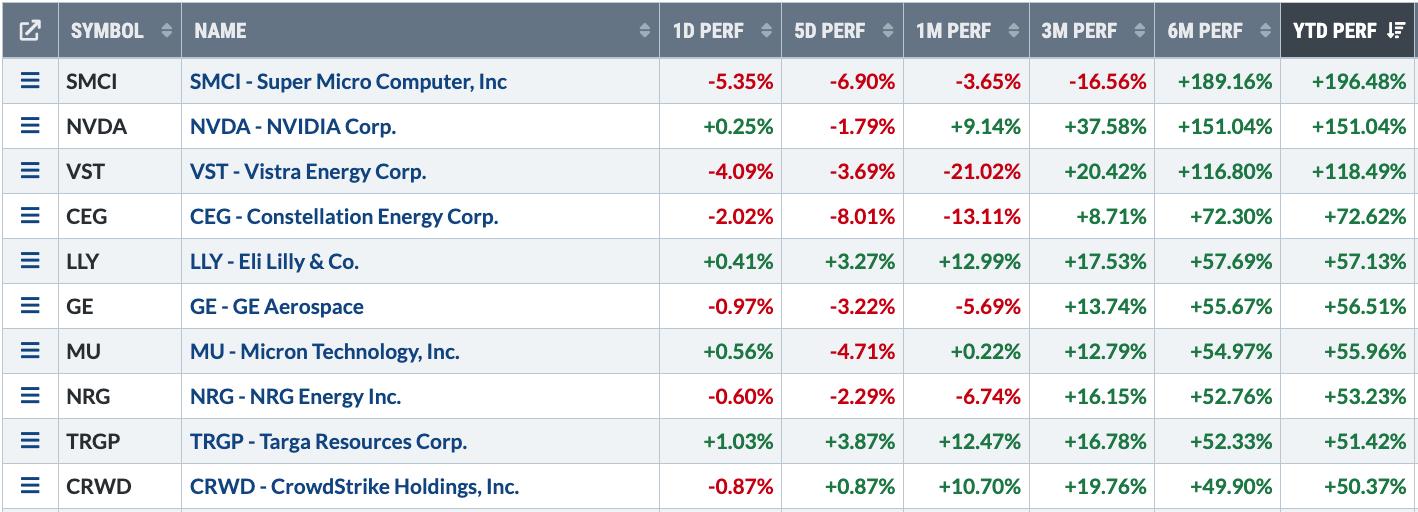
A small number of these strong performers are still pounding out new highs. For example, Eli Lilly (LLY) closed above $900 for the first time this month, continuing a run of incredible strength off its April low. But the real story is that many of these top performers are actually well off their 2024 highs.
NVDA spent this week about 10-15% below its all-time high earlier in June, while Super Micro Computer is still about 30% below its peak above $1200 in March. So the “best of the best” performers are not necessarily screaming strength going into Q3.
So which charts should we be watching going into July, which has traditionally been a very strong month for the S&P 500?
I hereby present the three charts I’ll be focused on, which I call the “MAG” stocks: Meta Platforms (META), Amazon.com (AMZN), and Alphabet (GOOGL). All three are at key technical moments, and all three have the opportunity to either confirm a new market uptrend or raise a red flag of caution. Let’s break them down one by one.
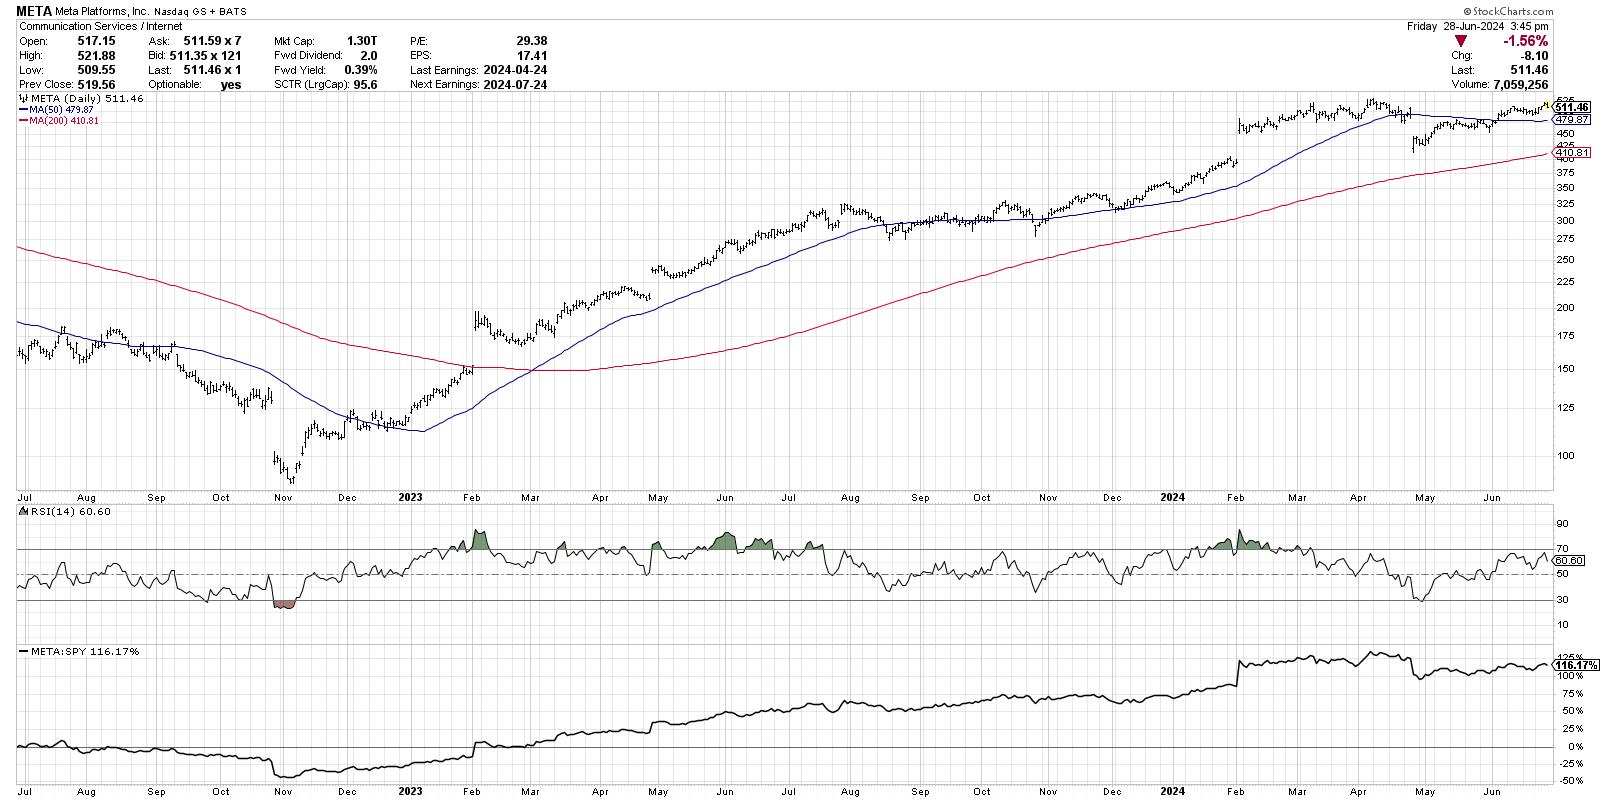
The question for META is whether it can trade not just to resistance but through resistance. Meta Platforms first reached $125 in March, then retested that resistance level again in April and once again in June. When price reaches a key resistance level, it’s all about whether an influx of willing buyers can push the price to new highs. This increase in buying power is what could propel META to new highs, which would certainly help the S&P 500 and Nasdaq achieve further highs.
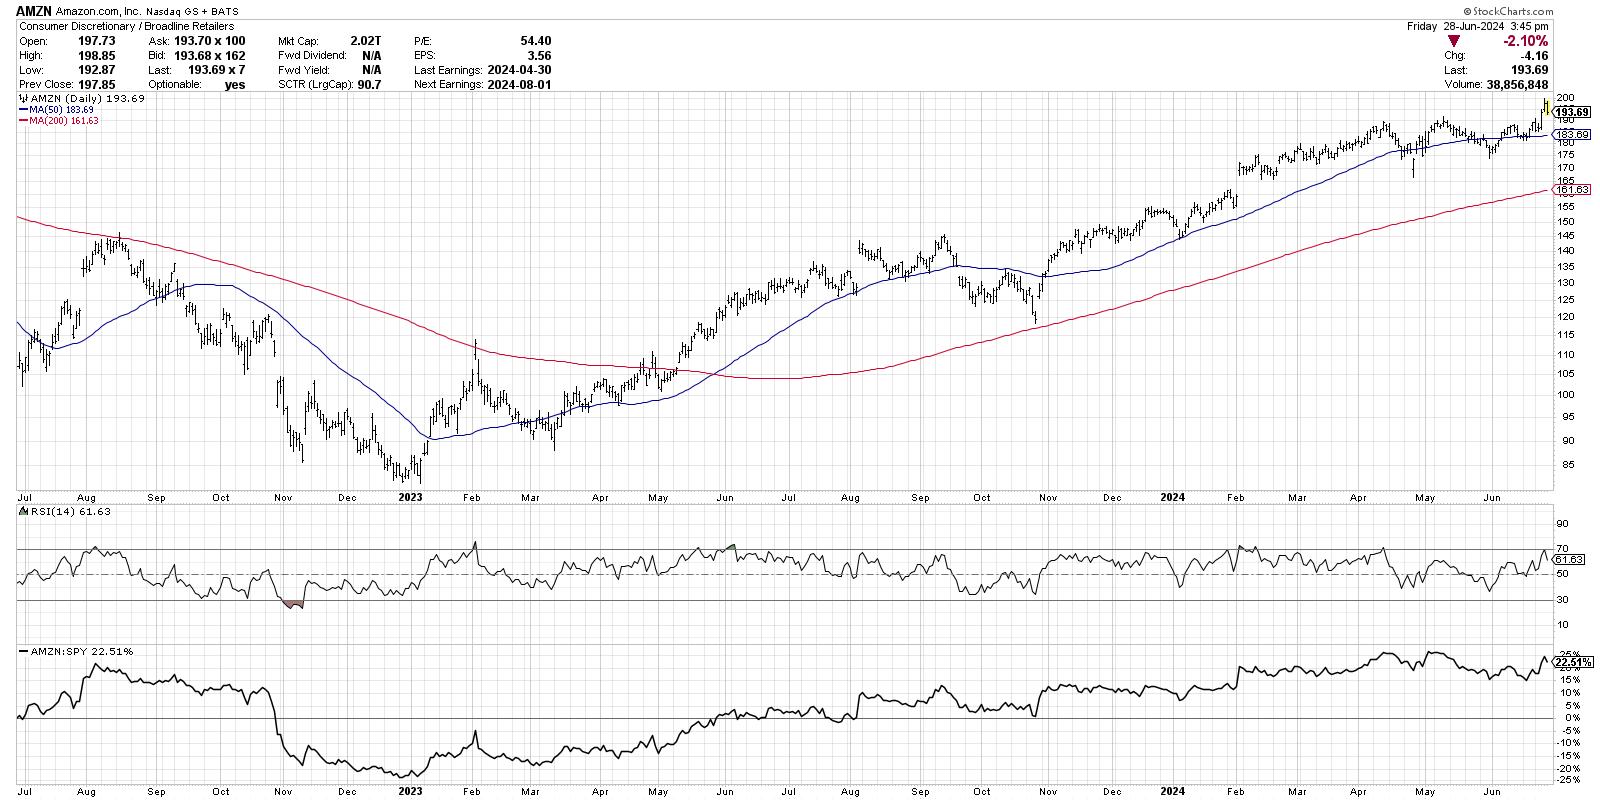
Amazon.com has already broken to new highs earlier in the week, but Friday’s session saw this leading consumer name pullback toward the breakout level at $190. For a chart like AMZN, it’s all about whether we can remain above the breakout level. Amazon over $190 is a strong chart with a recent breakout, but Amazon below $190 would represent a failed breakout and lack of upside follow-through.
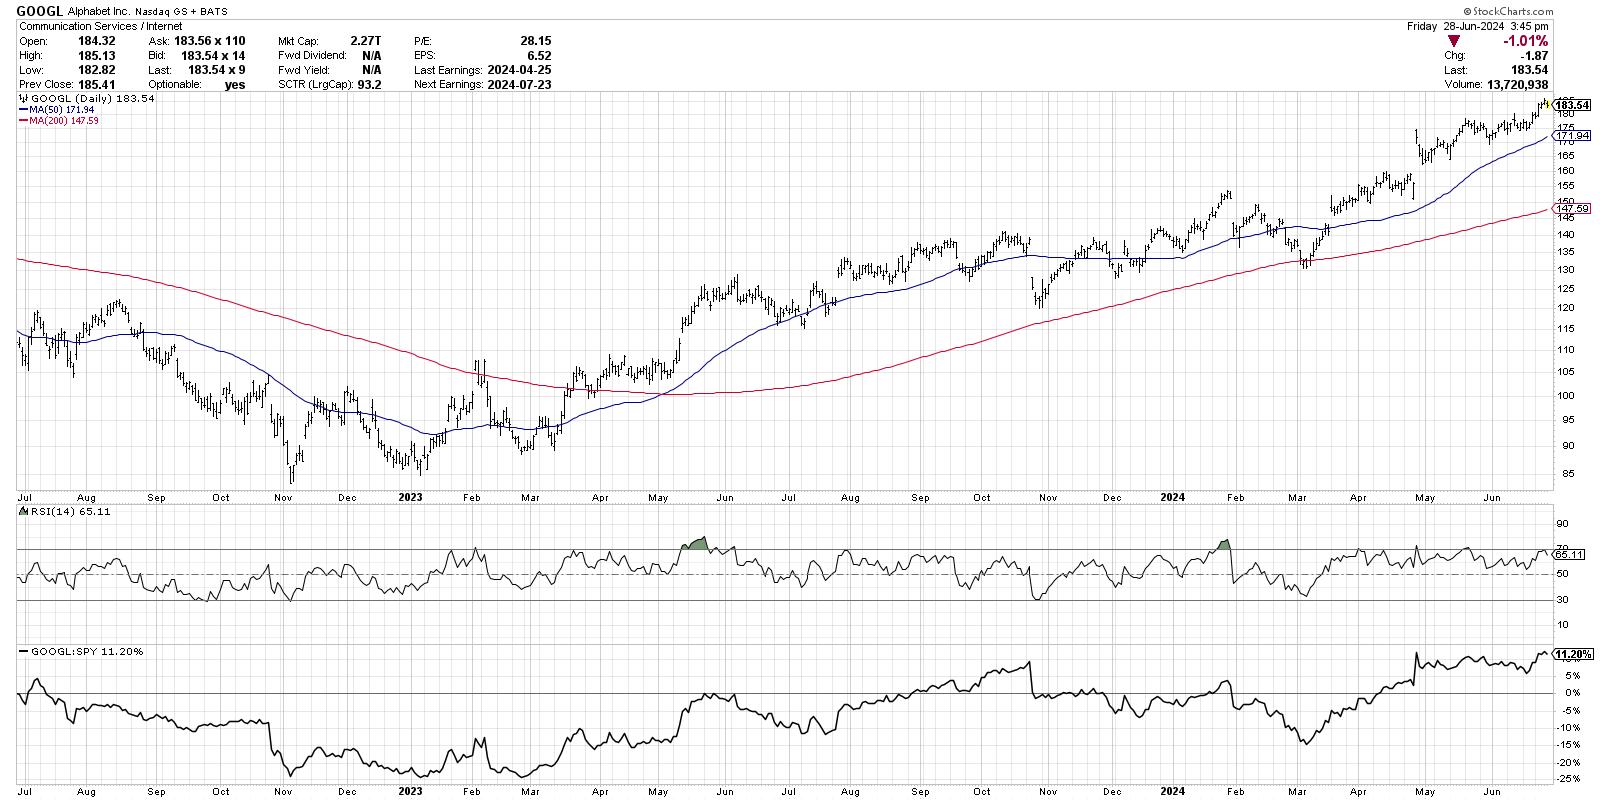
In Alphabet, we see a stock very clearly in a primary uptrend of higher highs and higher lows. Can GOOGL sustain the strong bull phase from Q2 into Q3? With this sort of technical configuration, I’m watching the pullbacks to see if GOOGL can keep making higher lows. My mentor Ralph Acampora would remind me to focus on higher lows in an uptrend, because, as long as the lows keep getting higher, the uptrend appears to be in good shape.
I’m also watching the RSI, which has been above 50 since mid-March. Strong charts have strong momentum, and RSI remaining above 50 would tell me that Alphabet is still in a position of strength among the largest US stocks.
So even though top performers like Nvidia have pulled back, our major equity benchmarks can certainly drive higher. But it will fall to charts like the MAG stocks to demonstrate that investors remain optimistic, and that the optimism is reflected in rising stock prices. Because as long as leading growth names keep leading, this market has plenty of upside potential.
RR#6,
Dave
P.S. Ready to upgrade your investment process? Check out my free behavioral investing course!
David Keller, CMT
Chief Market Strategist
StockCharts.com
Disclaimer: This blog is for educational purposes only and should not be construed as financial advice. The ideas and strategies should never be used without first assessing your own personal and financial situation, or without consulting a financial professional.
The author does not have a position in mentioned securities at the time of publication. Any opinions expressed herein are solely those of the author and do not in any way represent the views or opinions of any other person or entity.

