Week Ahead: NIFTY May Stay Tentative; Look For Stocks With Strong Relative Strength
The week that went by was in stark contrast to the week before that as the markets remained in an extremely narrow range before closing with modest gains. The markets demonstrated a peculiar feature over the past five sessions; on four out of five trading days, the Nifty 50 came off by over 100 points from its peak every day. However, the stark contrast was in the trading range that the markets displayed. In the previous week when the markets reacted to the elections, it swayed a total of 2057 points. This week, the trading range contracted to just 283.75 points. Volatility also continued to dramatically come down; last week it had come off by 31.38%, while this week, India VIX declined by another 24.05% to 12.82. Amid narrow-ranged moves, the headline index finally ended with a net weekly gain of 175.45 points (+0.75%).

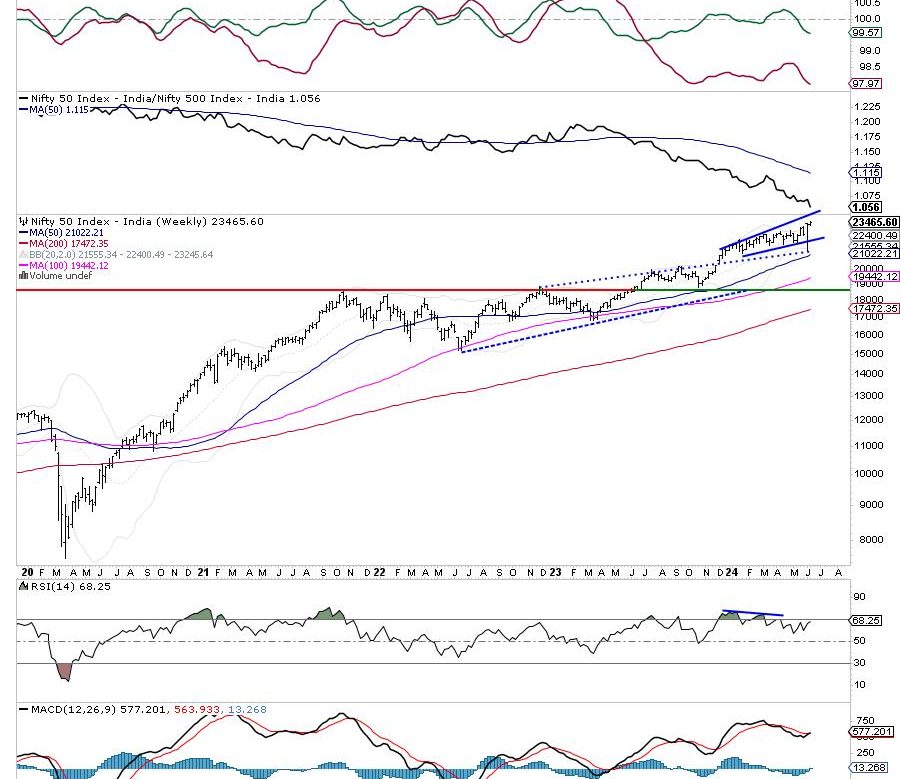
The coming week is a truncated week with Monday being a trading holiday on account of Bakri Eid. The markets have closed at their fresh lifetime highs; however, they remain below the rising channel that was violated. The Index is continuing to mark incremental highs but it is also continuing to resist the lower edge of the channel. Going by the derivatives data, Nifty has strong resistance in the 23550-23600 zone; unless these levels are taken out convincingly, a sustained upmove cannot be expected. Over the coming shortened week, the Nifty may also rise a bit but at the same time, it stays vulnerable to profit-taking from higher levels.
The markets would adjust to global trade setup when it opens on Tuesday and now the Nifty is in uncharted territory. The levels of 23550 and 23645 may play out as probable resistance levels. The supports come in lower at 23200 and 23050 levels.
The weekly RSI is 68.25; it continues to show bearish divergence against the price. While the prices are making new highs, the RSI is not. This has led to the emergence of a bearish divergence. The weekly MACD has now shown a positive crossover; it is now bullish and trades above the signal line.
The pattern analysis of the daily chart shows that while the Nifty is forming incremental lifetime highs, it is still not able to achieve a clean breakout. The Nifty had violated a rising channel on the daily charts in April; now it is seen resisting the lower edge of the same channel in the form of an extended trendline. Given the rising nature of this trendline, it is opening up some room every day for the Nifty to form a new high but at the same time, it offers resistance as well to the Index. Unless there is a strong convincing move above the 23550—23600 zone, a clean breakout may continue to elude the markets.
Overall, the markets are showing a lot of tentativeness at higher levels; however, there is no dispute about the fact that the underlying current remains strong. We may see some highly sector-specific shows playing out from the PSU/PSE space along with Energy stocks. At the same time, some defensive plays from FMCG and Pharma cannot be ruled out as well. It is recommended to keep leveraged exposures under control. The up moves from now on must be used to protect profits on the stocks that have run up too hard and effectively rotate the fresh buying in the stocks that are enjoying strong relative strength. A cautious outlook is advised over the coming week.
Sector Analysis for the coming week
In our look at Relative Rotation Graphs®, we compared various sectors against CNX500 (NIFTY 500 Index), which represents over 95% of the free float market cap of all the stocks listed.

Relative Rotation Graphs (RRG) show that the Nifty Realty index has rolled inside the leading quadrant. Besides this, the Metal, Midcap 100, Consumption, and Auto Indices are also inside the leading quadrant. These groups are likely to relatively outperform the broader Nifty 500 Index.
The Nifty PSE Index is seen sharply improving on its relative momentum while being placed inside the weakening quadrant. The Energy, PSU Bank, Infrastructure, and Commodities indices are inside the weakening quadrant as well.
The Nifty Services Sector index has rolled inside the lagging quadrant. The Nifty IT Index is also inside the lagging quadrant; however, it is seen improving its relative momentum against the broader markets.
The Media and FMCG indices are inside the improving quadrant and are seen maintaining their momentum. Banknifty is also inside the improving quadrant but it is seen slowly giving up on its relative momentum against the broader market.
Important Note: RRG™ charts show the relative strength and momentum of a group of stocks. In the above Chart, they show relative performance against NIFTY500 Index (Broader Markets) and should not be used directly as buy or sell signals.
Milan Vaishnav, CMT, MSTA
Consulting Technical Analyst