There is no denying that the primary trend for the S&P 500 remains bullish as we push to the end of Q2 2024. But what about the conditions “under the hood” of the major benchmarks? Today, we’ll highlight three “signs of the bear” we’re looking for, of which two may have already triggered, and what sort of confirmation could indicate a bearish reversal into the summer.
The first thing I’ve noticed about major market tops is that we tend to observe a proliferation of bearish momentum divergences. As prices push higher, we begin to see weaker momentum readings using an indicator like RSI. Let’s check out how the recent upswing for the S&P 500 has looked from a momentum perspective.

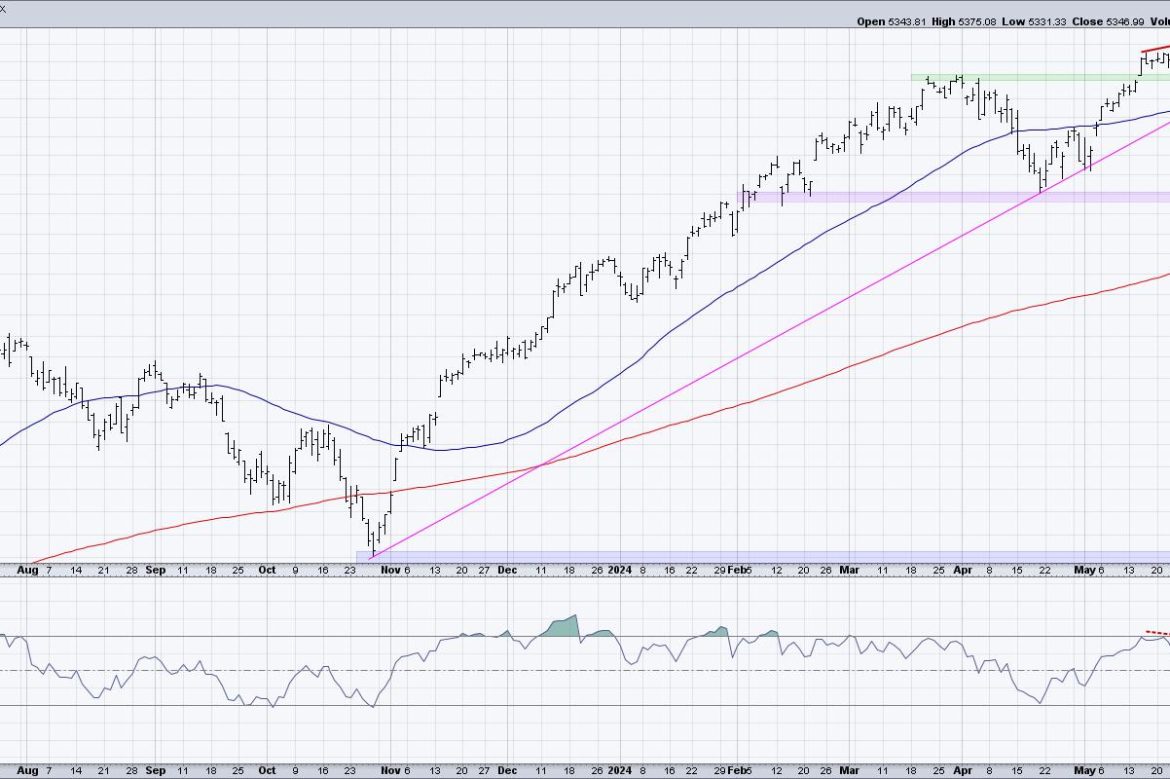
Here, we can see that the S&P 500’s RSI was around 70 when it first closed above 5300 in mid-May, but only around 65 on the recent push above 5350. Higher highs on weaker momentum indicates a potential exhaustion of buyers, with less emphasis on the most recent upswing.
And it’s not just about the S&P 500. Check out the daily chart of Amazon.com (AMZN), for a similar example in mid-May.

We can also see the bearish momentum divergence on stocks in the industrial sector, such as Northeast Ohio’s own Eaton Corp. (ETN).

While I would say next week is crucial for the S&P 500, to see if there’s another push above 5350 on stronger momentum, overall, the move higher in June generally speaking has been marked with lower momentum readings.
These “signs of the bear” are all part of a larger list that I call my Market Top Checklist, which is coming in super handy right about now! Want to follow along as we track each of the items on the checklist to gauge a potential market top in the summer? You need to be a Market Misbehavior premium member! Don’t forget to use code STOCKCHARTS for 20% off your first 12 months!
Another sign of the bear that I’d argue is very much in play is a lack of confirmation from market breadth indicators. Here’s a chart of the S&P 500 on a closing basis, along with the cumulative advance-decline lines for the New York Stock Exchange, S&P 500 large-caps, S&P 400 mid-caps, and S&P 600 small-caps.

Note that not only are all four of those advance-decline lines sloping lower over the last three weeks, but three of them finished this week below their 50-day moving averages. When a market moves higher, but breadth conditions fail to confirm those new highs, this suggests narrow leadership and potential toppy conditions.
I know what you’re thinking: “But Dave, isn’t that just because the Magnificent 7 stocks are dominating again?” And yes, you would be correct. And while our major benchmarks can indeed move higher driven by those mega-cap growth stocks, market history has shown that a healthy bull market phase tends to be marked by improving breadth readings. I’d feel way more optimistic about market conditions if I observed more stocks participating in the uptrend!
Now we come to the third sign of the bear, which is the breaking of “lines in the sand” for the major averages. Going back to our daily S&P 500 chart, do you see the pink trendline using the major lows since October 2023?

If you connect the October 2023 low to the mid-April low around 4950, you’ll see that trendline connects almost perfectly with subsequent lows in April and May. As long as the S&P 500 remains above this trendline, then the primary bull trend would remain largely intact. But if and when the SPX fails to hold this trendline, and perhaps if it would break below price and moving average support around 5200, then I would strongly consider planning for much further downside for risk assets.
In established bull market phases, mindless investors tend to think only of potential upside, as they believe the bull market will never end. Mindful investors know that, by looking for signs of a potential rotation, you can better protect your previous gains in the event of a downside correction!
RR#6,
Dave
P.S. Ready to upgrade your investment process? Check out my free behavioral investing course!
David Keller, CMT
Chief Market Strategist
StockCharts.com
Disclaimer: This blog is for educational purposes only and should not be construed as financial advice. The ideas and strategies should never be used without first assessing your own personal and financial situation, or without consulting a financial professional.
The author does not have a position in mentioned securities at the time of publication. Any opinions expressed herein are solely those of the author and do not in any way represent the views or opinions of any other person or entity.