
Music streamer Spotify Technology (SPOT) isn’t a cheap stock. But it might not be considered overvalued either, despite its earnings having been rather “spotty” (pardon the pun) and dipping into negative territory before last October.
Spotify’s performance has been remarkable over the past 16 months, with a consistent upward trajectory and a 98.4 SCTR score. It recently surpassed its highest point reached in the past 52 weeks, indicating the possibility of a sustained growth trend.
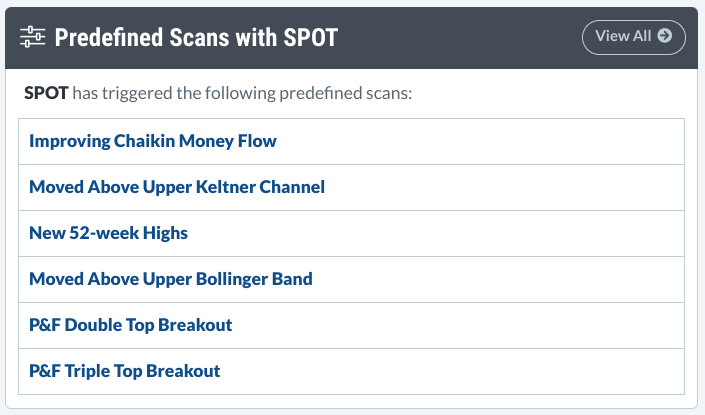
The stock popped up on a StockCharts New 52-week Highs scan on Tuesday. If you checked StockCharts’ Symbol Summary on Tuesday, as shown below, it also popped on five other bullish scans (all of which are a great way to find potential trade opportunities, by the way).
What’s the Big News on Spotify?
Essentially, Spotify announced a price increase for all its plans, particularly in the US, aiming to boost profitability and cash flow. This means significantly improved cash flow (it’s aiming for a billion dollars in free cash flow by the end of the year). Spotify’s gross profit has also risen, driven by increased revenue and reduced operating costs.
However, the exciting stories may be its audiobook bundling strategy and future growth drivers via advertising and video monetization (imagine what the company can do in those areas). Despite not being cheap, SPOT has shown strong growth potential, and analysts are generally bullish on the stock. (Deutsche Bank maintains a $400 price target, and other analysts are forecasting a high of $485 by the end of next year.)
The Macro Picture
What do you get when you combine technical know-how with fundamental contrarian speculation? Probably something like the breakout in April to March of 2023 (see blue arrow in the weekly chart of SPOT below). At the time, Spotify was at the tail-end of a year-long series of consecutive negative earnings.

CHART 1. WEEKLY CHART OF SPOTIFY. Note that the March to April 2023 technical breakout kicked off the uptrend despite negative earnings.
Those who waited for Spotify earnings to improve significantly would have entered later in October of that year (see green arrow), which was half the distance between SPOT’s trough in 2023 and today’s peak.
The blue dotted line at $387 marks Spotify’s all-time high. While this will likely present a resistance level for the stock, it’s still below analysts’ high price targets for 2024 and 2025 ($400 and $485, respectively).
The daily chart of SPOT below shows that if you like to buy on strong breakouts, Tuesday would have been the day to pull the trigger (either during the breakout or after the close).
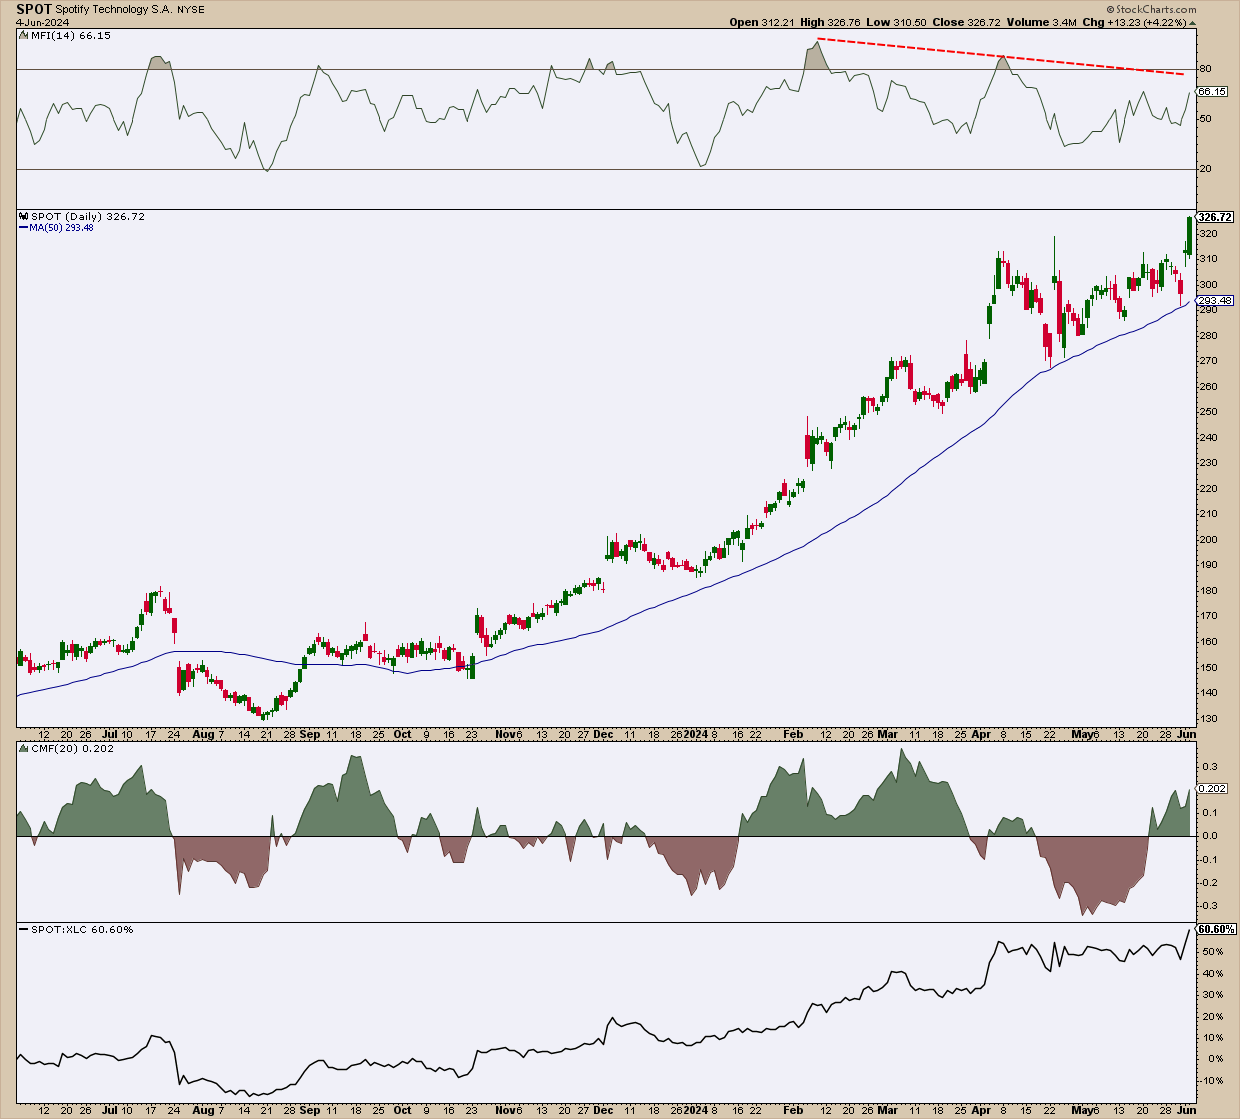
CHART 2. DAILY CHART OF SPOTIFY. Note that the Chaikin Money Flow (CMF) indicator is above the zero line, indicating rising bullish momentum.
If you missed it and are looking for a second entry, then you might wait for SPOT to decline toward the 50-day Simple Moving Average (SMA); note how closely it follows the 50-day SMA and how traders look to it as a level of support. However, be aware that other indicators are showing mixed signals.
The divergence between Spotify’s price and the Money Flow Index (MFI) (see red dotted line in top panel) indicates near-term bearishness. On a bullish note, the Chaikin Money Flow (CMF) presents a scenario in which momentum appears to be picking up when Spotify is outperforming its sector (Communications; XLC) by 60%.
The Takeaway
While buying breakouts above significant high marks may be a part of some traders’ strategies, others may feel a bit more hesitant, worried they’re buying a top. Spotify presents this conundrum. Still, fundamental targets are a ways away, and if SPOT does drift downward, the price will likely find support at the 50-day SMA (potentially a favorable second entry for those who missed entering the first time around).
Also, note that SPOT’s earnings are just around the corner—July 23, before the market opens. Again, you will find much of this information and more from the StockCharts Symbol Summary for SPOT.
Disclaimer: This blog is for educational purposes only and should not be construed as financial advice. The ideas and strategies should never be used without first assessing your own personal and financial situation, or without consulting a financial professional.